Here are a couple of my favorite debugging tricks and tips I use while working on Swift projects.
Configure your .lldbinit
First, most of us want to work with Swift, not Objective-C, but depending on your project setup, you might have Objective-C enabled by default. We have 2 options:
- We can manually change the language during the lldb session by calling
settings set target.language swift - We can create a
.lldbinitfile in our home directory and add it there to be the default for all debugging sessions e.g.echo 'settings set target.language swift' > ~/.lldbinitfollowed bychmod +x ~/.lldbinit
Furthermore, .lldbinit is a great place to add additional things that you’ll be using across your projects. Here is a part of mine:
settings set target.language swift
breakpoint set -r NSWindow.initialFirstResponder --one-shot true --auto-continue true
breakpoint command add
e import AppKit
e import Foundation
e func $vc<T>(_ input: T) -> NSViewController { unsafeBitCast(input, to: NSViewController.self) }
e func $view<T>(_ input: T) -> NSView { unsafeBitCast(input, to: NSView.self) }
DONE

breakpoint set -n UIApplicationMain --one-shot true --auto-continue true
breakpoint command add
e import UIKit
e import Foundation
e func $vc<T>(_ input: T) -> UIViewController { unsafeBitCast(input, to: UIViewController.self) }
e func $view<T>(_ input: T) -> UIView { unsafeBitCast(input, to: UIView.self) }
DONE
This allows me to use memory address to get info about my types easily:
po $vc(0x128027ad400)
Notes:
- Using $ for variable and function names is how we get those things available outside of just the current expression context, from Apple:
If the first character of your user defined variable is a $, then the variable’s value will be available in future expressions, otherwise it will just be available in the current expression.
- We configure the initial breakpoint as a trigger for adding new functions into the system. Otherwise, they wouldn’t work since expressions aren’t evaluated as part of lldb initialization due to lack of stack frames
- I work in both Mac and iOS context so I set 2 separate breakpoints and variants of the common functions I use
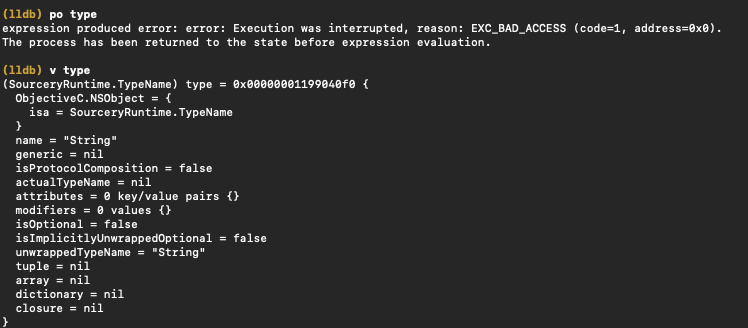
Leverage frame variables
Most Swift engineers are used to using print object or po for short, but there is an alternative that often works faster and works in cases when po might fall short: frame variable or v
The short alias was added back in Xcode 10.2, and here’s Apple note about it
The LLDB debugger has a new command alias, v, for the **“frame variable” **command to print variables in the current stack frame. Because it bypasses the expression evaluator, v can be a lot faster and should be preferred over p or po. https://developer.apple.com/documentation/xcode_release_notes/xcode_10_2_release_notes
🤔
v and vo works for stored properties but won’t work for computed ones. You’ll need po for those.
Here’s an example:
Use expressions
The aforementioned **po**is an alias for a **e -O –**which will evaluate the object and try to call description method on it if it exists, it will evaluate the given expression and then try calling description method on it.
But expressions are more valuable than that, and it would be worth using them directly instead of relying on **po**.
We can interact with our system by leveraging e or expression, this can be very convenient when dealing with variables:
e var $vc = self.controllere $vc.view.layer.borderColor = CGColor.red
e CATransation.flush() // Refresh the core animation screen without having to end debugging sessionObserve the system
We can leverage breakpoints for many things, from changing default inputs into fields (e.g. login forms):
 To using debugger commands to build symbolic breakpoint chains, e.g.
breakpoint set --name "[CommandBarInputContainer layout]"
Would create a breakpoint on the layout call of my NSView, now this would be too frequent, but I could set it up as part of another breakpoint execution, e.g. when the user changes the text input.
I could also use --one-shot true to only execute the breakpoint once per trigger.
Watch variable change
We can add breakpoints when a variable changes, either through Xcode UI or lldb command:
watchpoint set variable self.homeViewController
 Watchpoint UI
Then whenever that variable changes, Xcode will stop our debugging session and give us info like this:
Watchpoint UI
Then whenever that variable changes, Xcode will stop our debugging session and give us info like this:
 We can then print and interact with that value
po value▿ Optional<NSViewController>
▿ some : <HomeButton.HomeViewController: 0x13407cf3ac0>What are your favorites?
Let me know what your favorite tips or lldb commands are!